Once a store is past roughly $200k, "look at the last few months and guess" stops working. Cash gets tied up in slow movers and the winners run dry. Here is the whole setup that works at that size before you need forecasting software, five steps, all doable in a spreadsheet.
1. Sort SKUs A / B / C by revenue
Rank every product by trailing revenue and add up the running percentage. The top slice making ~80% of revenue is your A-items, the next ~15% is B, the last ~5% is C. In most catalogs the A group is only 15–20% of the SKU count but nearly all the cash. Those get tight, frequent review; C-items get a simple min/max and a low cap.
2. Turn history into a sell rate
Units sold ÷ days in the period = average units per day. Then days of stock = units on hand ÷ daily rate. 120 units at 6/day = 20 days of cover. Use a trailing 30/60/90-day window, not two years of stale history.
3. Correct the baseline for what you can already see
Velocity is a starting point, not the forecast. Adjust for promotions (apply the multiplier the same promo did last time), seasonality (pull the same calendar weeks from last year), and known channel shifts. You are not predicting from nothing, you are correcting a known baseline for known events.
4. Reorder by date, working back from the stockout
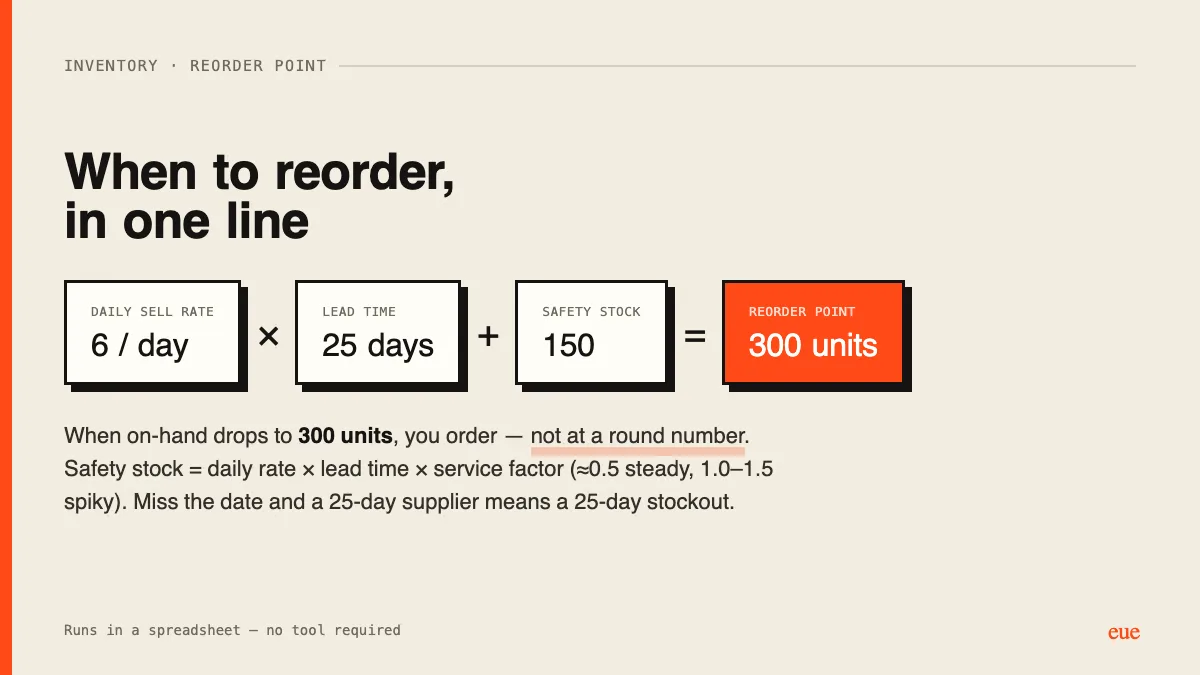
Reorder point in units = (daily rate × lead time) + safety stock. Safety stock ≈ daily rate × lead time × a service factor (~0.5 steady, 1.0–1.5 spiky). 6/day, 25-day lead, spiky = (6×25) + (6×25×1.0) = 300 units. When on-hand hits 300, you order.
5. Match inventory to lead time
Days on hand should track lead time, not habit. If a C-item restocks in a week, don't hold 90 days of it. Pull that cash back into A-items where a stockout costs a real sale.
Two things separate a working system from an abandoned spreadsheet: track forecast vs actual each month, and accept that some SKUs (new products, one-off spikes, very low volume) are unforecastable. Give those a conservative min/max and move on.
How do you handle the seasonality and promo adjustment? That is the part I am least sure about, and I would take any multipliers that have worked for you.
I log every promo. Date, discount, units it moved vs a normal week.
After 3 or 4 you stop guessing the multiplier. You read it off the log.
Seasonality same thing. One number per SKU, peak week over average week. No curve fitting.